
This article will give a brief overview of the OnBase Diagnostics Console, with advice provided by Senior Solutions Architect and OnBase Practice Lead for RPI Consultants, Sydney Isle. Simply put, the OnBase Diagnostics Console is one of the most powerful tools an OnBase Administrator has available to them. It provides comprehensive visibility into what’s going on “under the hood” in any OnBase environment. It is flexible, easy to use, and can be monitored in real time or run in the background (saving logs to a text file for later review).
- If your build number is not available openly on Community, contact your support team for a secure download link.
- Once you have the installer, the wizard will walk you through installing the Diagnostics Service and Console on your application server.
- NOTE: If you have multiple application servers in your environment, be sure to install it on each server.

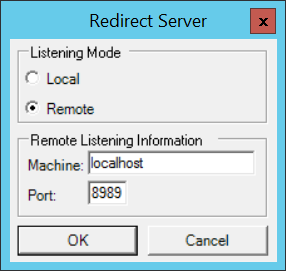
This gives you the option to monitor a server other than the one on which the Diagnostics Console is installed. Choose “Local” to monitor the application server on the local machine. Choose “Remote” to monitor another machine, and type the machine name of the application server in the “Machine” field. The port number should always be 8989.
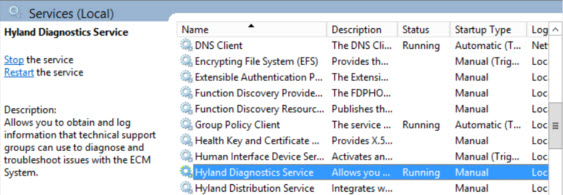
Service Not RunningYou’ll get this message whenever you launch Diagnostics Console if the service isn’t running on launch. Click “Yes” to start the service automatically.
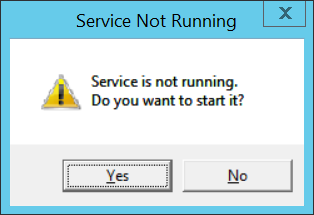
You may get a couple of additional prompts about needing administrator privileges to start the service. Click through them until you get to the main Diagnostics Console screen.
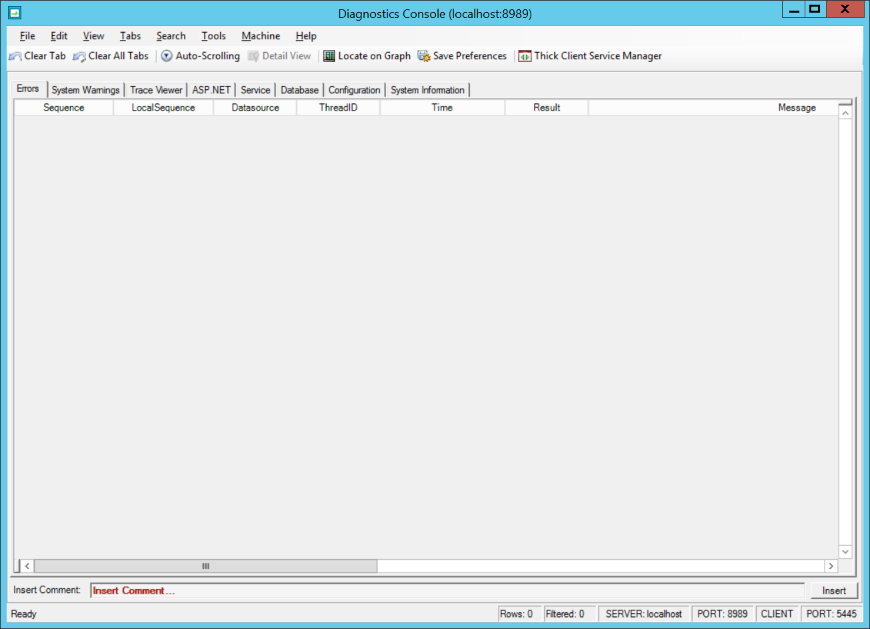
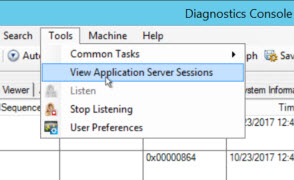
8 You also have the ability to export logs to Excel, XML or text files, retrieve NTService logs, view previously saved logs, and manage legacy Thick Client services from Diagnostics Console.
There are many more features within the Diagnostics Console than can be covered in one article. Hopefully, this helps to give you a head start on becoming more familiar with this powerful tool for troubleshooting OnBase!